Report provides an analysis of temperature data and operating conditions collected by OneVue Temperature Sensors for the previous 7 days and recommendations based on the computed data. The report is designed to provide the information needed by staff to detect patterns and serve as a source of intelligent, computed data to support decisions or analysis of monitored temperature conditions.
This report's Interval Settings are set by OneVue
Manual interval: requires the report to be generated by a user and cannot be scheduled to be generated by OneVue.
Report interval (date range): set to the previous 7 days and cannot be changed by a user.
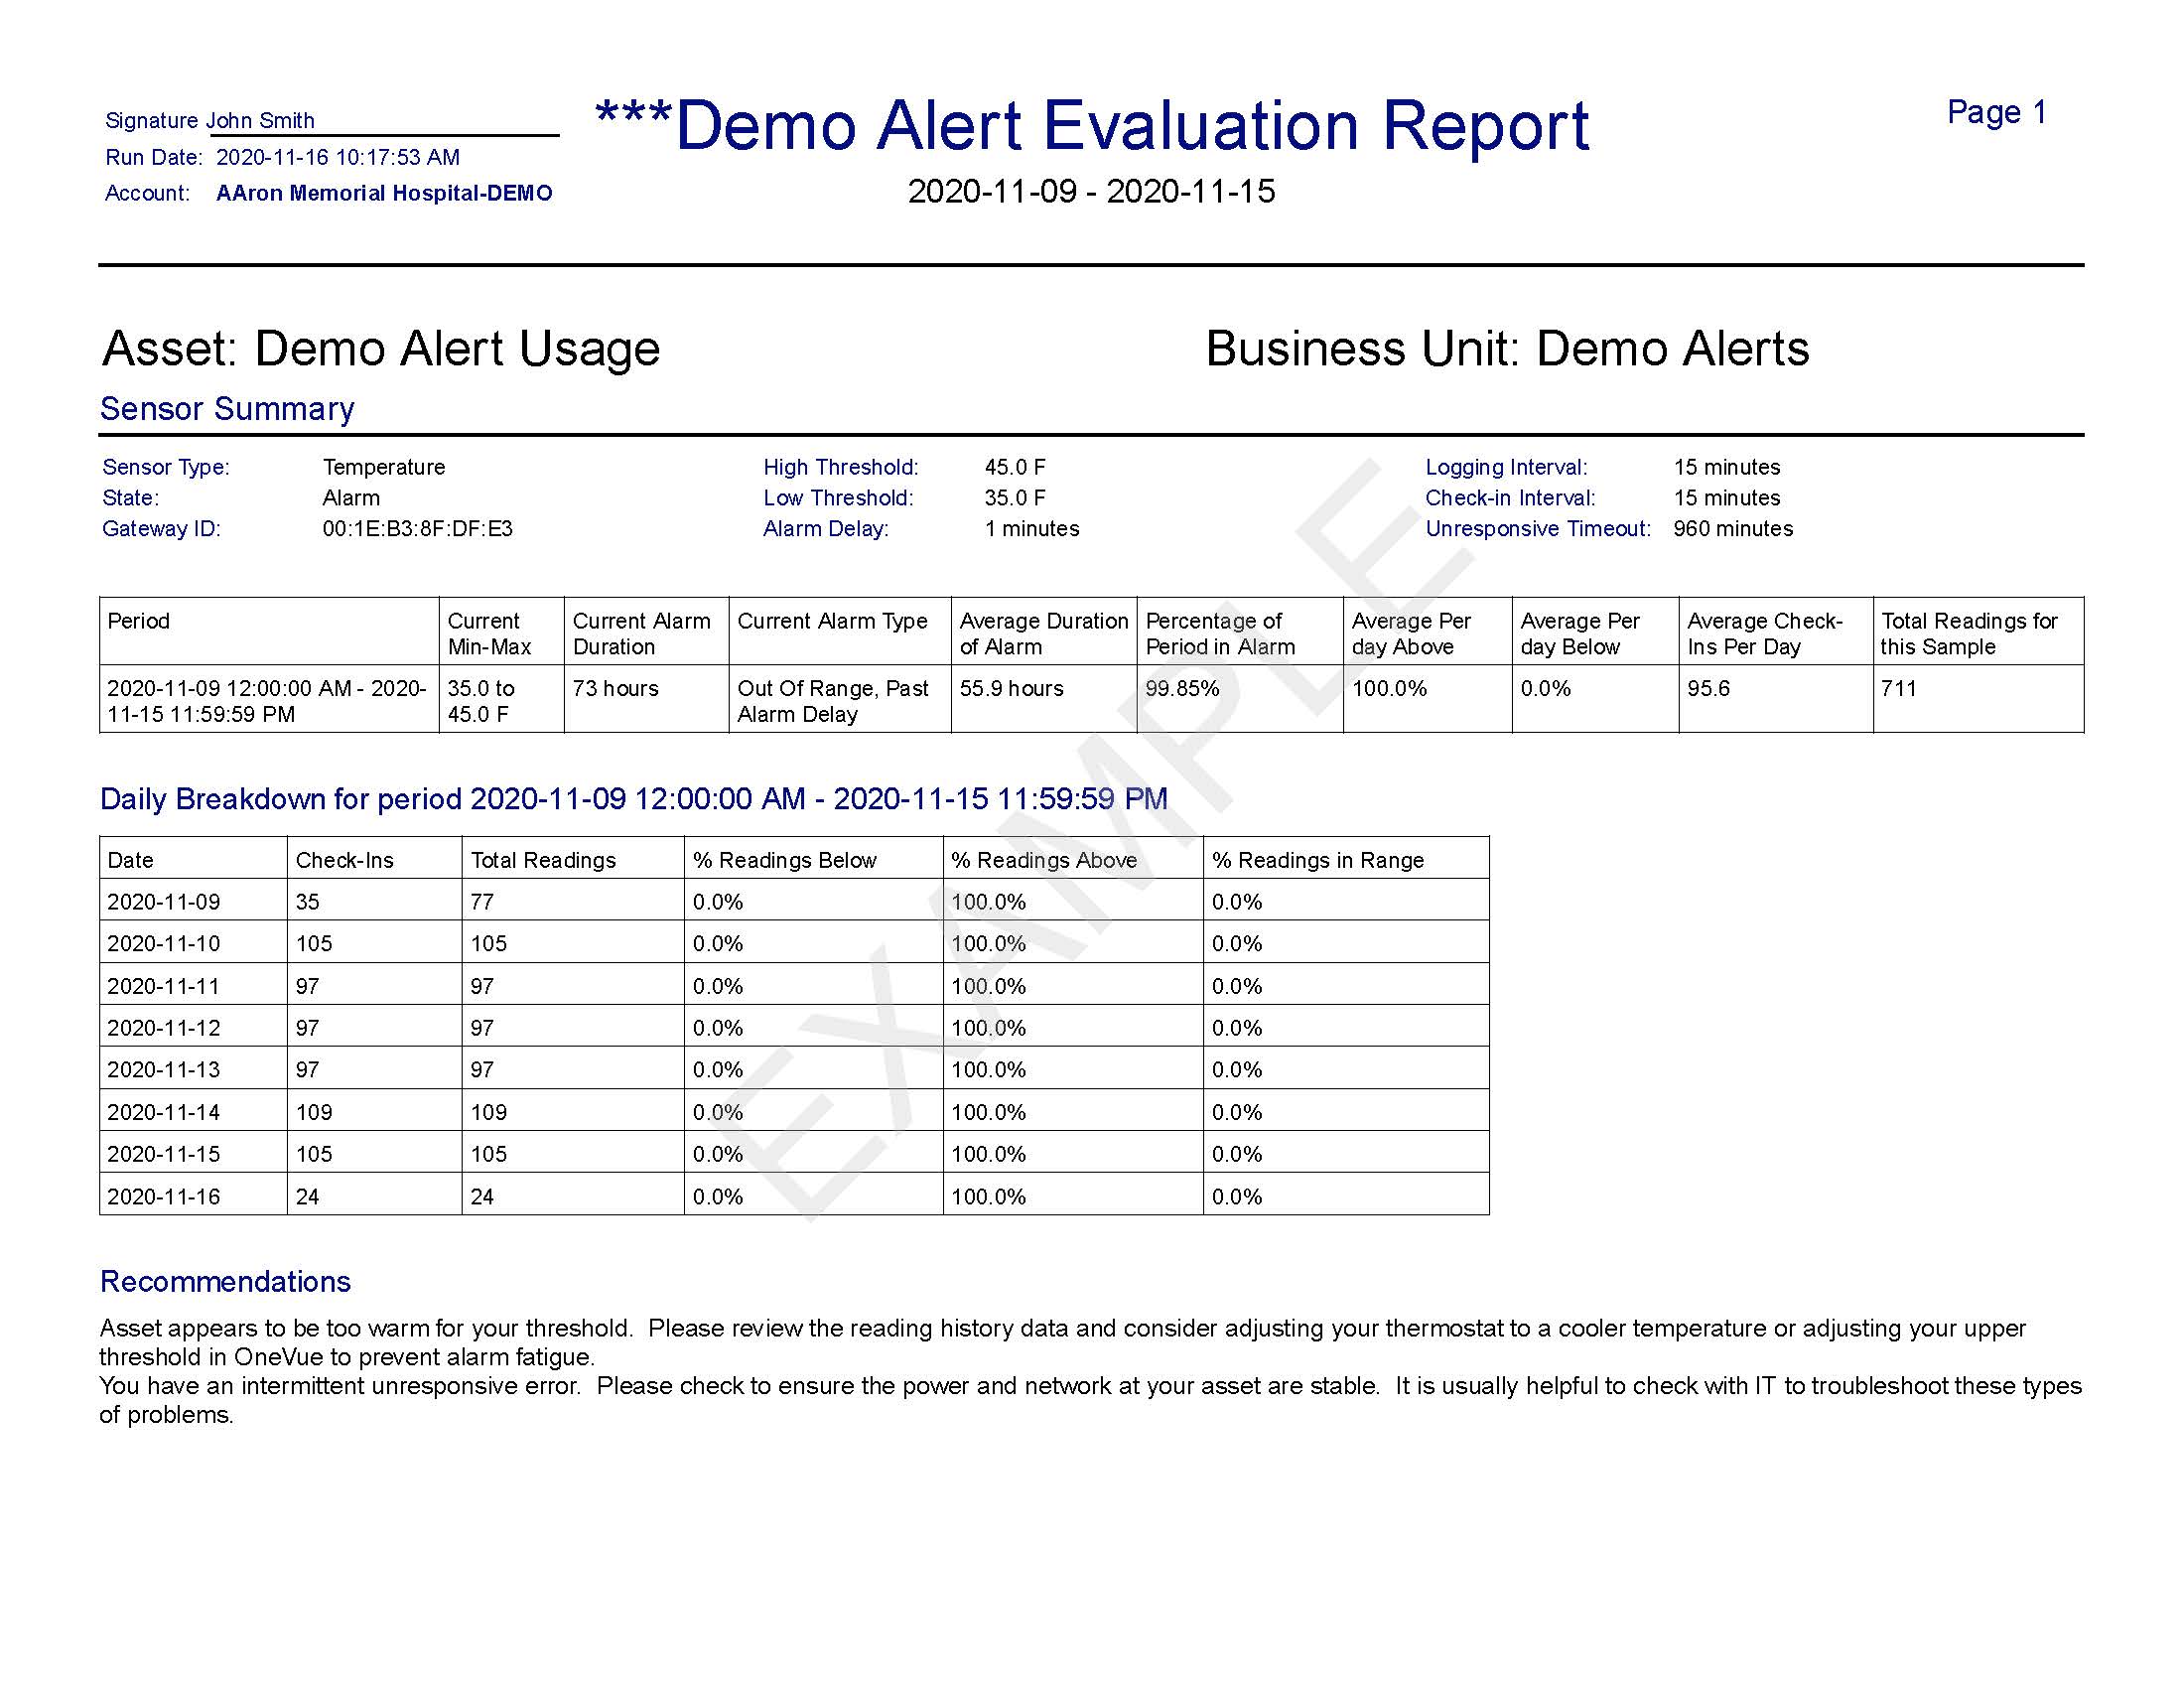
Sensor Summary detail
Provides state and setting details for the report time period.
Report period detail
-
Period
Start and end date of the sensor data collected and computed.
-
Current Min-Max
The sensor’s Normal Condition minimum and maximum setting value. The Normal Condition (range/threshold) is set to the expected, normal operating condition of its assigned Monitored Asset.
-
Mean Temp
The average mean value of the readings for the reporting period; the calculated value of the sum of all readings divided by the total sample points (readings).
-
Currently in Alarm
Indicates if the sensor/Monitored Asset is currently in an active Alarm state.
-
Current Alarm Duration
If currently in an Alarm state, it displays how long it has been in the current Alarm state.
-
Current Alarm Type
If currently in an Alarm state, it indicates the condition (status) that resulted in the Monitored Asset and sensor entering the current Alarm state.
-
Average Duration of Alarm
The average amount of time in an Alarm state. Data computed includes all Alarm events for the reporting period.
-
Percentage of Period in Alarm
Percentage in an Alarm state based on the time computed in the Average Duration of Alarm value. A higher percentage is a key indicator to investigate and resolve the cause of frequent alarm events.
-
Average Per day Above
The daily average of the readings above the maximum threshold (sensor's Normal Condition setting value) for the reporting period.
-
Average Per day Below
The daily average of the readings below the minimum threshold (sensor's Normal Condition setting value) for the reporting period.
-
Average Check-Ins Per Day
The average number of daily check-ins for the reporting period. The daily average of how many times the sensor checked-in to OneVue for the reporting period. A higher percentage of check-ins may indicate that check-ins are occurring more frequently due to out-of-range readings.
-
Total Ready for this Sample
The total number of readings for the reporting period.
Daily Breakdown for period detail
-
Date
Start and end date of the sensor data collected and computed.
-
Check-Ins
The total number of check-ins for the specific date.
-
Total Readings
The total number of readings for the specific date.
-
% Readings Below
Percentage of readings that were below the minimum threshold (sensor's Normal Condition setting value) for the specific date.
-
% Readings Above
Percentage of readings that were above the maximum threshold (sensor's Normal Condition setting value) for the specific date.
-
% Readings in Range
Percentage of readings that were in range of the sensor's Normal Condition for the specific date.